Prometheus Operator
2 minute read
This document provides deployment steps to install and configure Prometheus Operator in a Kubernetes cluster.
Install the prometheus operator
Please follow the documentation to install prometheus operator or simply run the following command:
curl -sL https://github.com/prometheus-operator/prometheus-operator/releases/download/v0.81.0/bundle.yaml | kubectl create -f -
Ensure that the Prometheus Operator Pod is running successfully.
# Installing the prometheus operator
root@VM-0-5-ubuntu:/home/ubuntu# kubectl get pods
NAME                                   READY   STATUS    RESTARTS   AGE
prometheus-operator-55b5c96cf8-jl2nx   1/1     Running   0          12s
Install the ServiceMonitor CR for llmaz
To enable monitoring for the llmaz system, you need to install the ServiceMonitor custom resource (CR).
You can either modify the Helm chart prometheus according to the documentation or use make install-prometheus in Makefile.
- Using Helm Chart: to modify the values.global.yaml
prometheus:
  # -- Whether to enable Prometheus metrics exporting.
  enable: true
- Using Makefile Command:
make install-prometheus
root@VM-0-5-ubuntu:/home/ubuntu/llmaz# make install-prometheus
kubectl apply --server-side -k config/prometheus
serviceaccount/llmaz-prometheus serverside-applied
clusterrole.rbac.authorization.k8s.io/llmaz-prometheus serverside-applied
clusterrolebinding.rbac.authorization.k8s.io/llmaz-prometheus serverside-applied
prometheus.monitoring.coreos.com/llmaz-prometheus serverside-applied
servicemonitor.monitoring.coreos.com/llmaz-controller-manager-metrics-monitor serverside-applied
Check Related Resources
Verify that the necessary resources have been created:
- ServiceMonitor
root@VM-0-5-ubuntu:/home/ubuntu/llmaz# kubectl get ServiceMonitor -n llmaz-system
NAME                                       AGE
llmaz-controller-manager-metrics-monitor   59s
- Prometheus Pods
root@VM-0-5-ubuntu:/home/ubuntu/llmaz# kubectl get pods -n llmaz-system
NAME                                        READY   STATUS    RESTARTS   AGE
llmaz-controller-manager-7ff8f7d9bd-vztls   2/2     Running   0          28s
prometheus-llmaz-prometheus-0               2/2     Running   0          27s
- Services
root@VM-0-5-ubuntu:/home/ubuntu/llmaz# kubectl get svc -n llmaz-system
NAME                                       TYPE        CLUSTER-IP      EXTERNAL-IP   PORT(S)    AGE
llmaz-controller-manager-metrics-service   ClusterIP   10.96.79.226    <none>        8443/TCP   46s
llmaz-webhook-service                      ClusterIP   10.96.249.226   <none>        443/TCP    46s
prometheus-operated                        ClusterIP   None            <none>        9090/TCP   45s
View metrics using the prometheus UI
Use port forwarding to access the Prometheus UI from your local machine:
root@VM-0-5-ubuntu:/home/ubuntu# kubectl port-forward services/prometheus-operated 9090:9090 --address 0.0.0.0 -n llmaz-system
Forwarding from 0.0.0.0:9090 -> 9090
If using kind, we can use port-forward, kubectl port-forward services/prometheus-operated 39090:9090 --address 0.0.0.0 -n llmaz-system
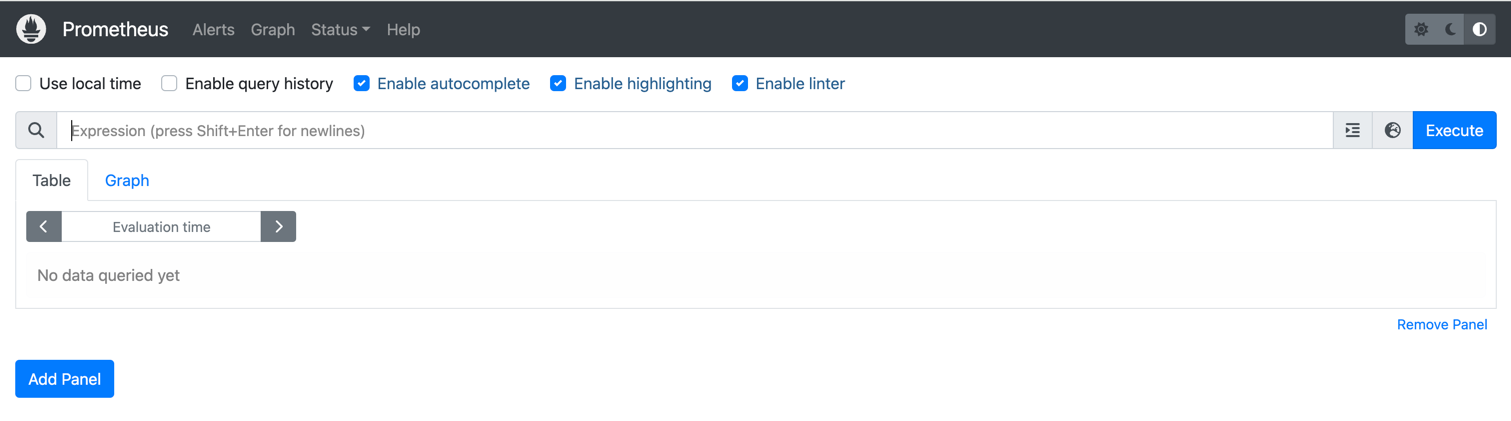
This allows us to access prometheus using a browser: http://localhost:9090/query
Feedback
Was this page helpful?
Glad to hear it! Please tell us how we can improve.
Sorry to hear that. Please tell us how we can improve.